


Tiếng Anh 9 Unit 3 3.7 Writing
1 Look at the photo. What does each graph show? 2 Read the paragraph below and answer the questions.3 Read the Writing box. Then complete the sentences with the correct form of the phrases in brackets.
Bài 1
1 Look at the photo. What does each graph show?
(Nhìn vào bức hình. Mỗi biểu đồ thể hiện điều gì?)
Lời giải chi tiết:
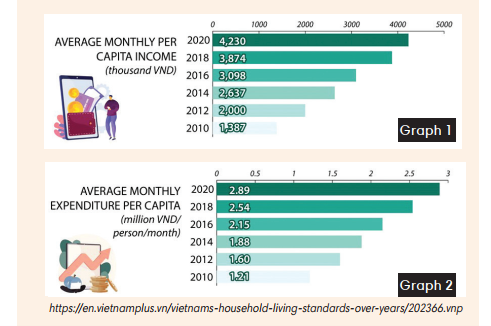
The first chart describes the average monthly income per capita from 2010 to 2020. The second chart depicts average monthly spending per capita from 2010 to 2020.
(Biểu đồ thứ nhất mô tả về thu nhập bình quân đầu người tháng từ năm 2010 đến năm 2020. Biểu đồ thứ 2 miêu tả chi tiêu trung bình hàng tháng đầu người từ năm 2010 đến năm 2020.)
Bài 2
2 Read the paragraph below and answer the questions.
(Đọc đoạn văn dưới đây và trả lời các câu hỏi.)
The two graphs show the changes in average monthly per capita income and average monthly expenditure per capita in a period of 10 years. It is clear that Vietnamese incomes and expenditures increased consistently over the given period. In the first graph, the average monthly per capital income increased over three times between 2010 and 2020. In 2010, the average monthly per capital income was 1.387 million VND, but this rose sharply to 4.230 million VND after ten years. Similarly, the second graph shows a steady increase in average monthly expenditure per capital per person. This number jumped dramatically from 1.21 million VND to 2.89 million VND over the same decade.
(Hai biểu đồ thể hiện sự thay đổi về thu nhập bình quân đầu người hàng tháng và chi tiêu bình quân đầu người hàng tháng trong khoảng thời gian 10 năm. Rõ ràng là thu nhập và chi tiêu của Việt Nam tăng đều đặn trong khoảng thời gian nhất định. Trong biểu đồ đầu tiên, thu nhập bình quân đầu người hàng tháng đã tăng hơn ba lần trong khoảng thời gian từ 2010 đến 2020. Năm 2010, thu nhập bình quân đầu người hàng tháng là 1,387 triệu đồng, nhưng con số này đã tăng mạnh lên 4,230 triệu đồng sau 10 năm. Tương tự, biểu đồ thứ hai cho thấy mức tăng đều đặn trong chi tiêu bình quân hàng tháng trên đầu người trên mỗi người. Con số này tăng vọt từ 1,21 triệu đồng lên 2,89 triệu đồng trong cùng thập kỷ.)
1 How many graphs are being compared?
(Có bao nhiêu đồ thị đang được so sánh?)
2 What time period do the graphs show?
(Đồ thị thể hiện khoảng thời gian nào?)
3 What is the general trend in both graphs?
(Xu hướng chung trong cả hai đồ thị là gì?)
4 What are some significant data included in the report?
(Một số dữ liệu quan trọng có trong báo cáo là gì?)
Lời giải chi tiết:
1 Two graphs are being compared.
(Hai biểu đồ đang được so sánh.)
Thông tin: The two graphs show the changes in average monthly per capita income and average monthly expenditure per capita in a period of 10 years.
((Hai biểu đồ thể hiện sự thay đổi về thu nhập bình quân đầu người hàng tháng và chi tiêu bình quân đầu người hàng tháng trong khoảng thời gian 10 năm.)
2 The graphs show a period of 10 years, from 2010 to 2020.
(Đồ thị thể hiện khoảng thời gian 10 năm, từ 2010 đến 2020.)
Thông tin: In the first graph, the average monthly per capital income increased over three times between 2010 and 2020. This number jumped dramatically from 1.21 million VND to 2.89 million VND over the same decade.
(Trong biểu đồ đầu tiên, thu nhập bình quân đầu người hàng tháng đã tăng hơn ba lần trong khoảng thời gian từ 2010 đến 2020. Con số này tăng vọt từ 1,21 triệu đồng lên 2,89 triệu đồng trong cùng thập kỷ.)
3 The general trend in both graphs is an increase in average monthly per capita income and average monthly expenditure per capita over the given 10-year period.
(Xu hướng chung trong cả hai biểu đồ là sự gia tăng thu nhập bình quân đầu người hàng tháng và chi tiêu bình quân đầu người hàng tháng trong khoảng thời gian 10 năm nhất định.)
Thông tin: In the first graph, the average monthly per capital income increased over three times between 2010 and 2020. Similarly, the second graph shows a steady increase in average monthly expenditure per capital per person.
((Trong biểu đồ đầu tiên, thu nhập bình quân đầu người hàng tháng đã tăng hơn ba lần trong khoảng thời gian từ 2010 đến 2020. Tương tự, biểu đồ thứ hai cho thấy mức tăng đều đặn trong chi tiêu bình quân hàng tháng trên đầu người trên mỗi người.)
4 Significant data in the report include the threefold increase in average monthly per capita income from 1.387 million VND in 2010 to 4.230 million VND in 2020, as well as the notable rise in average monthly expenditure per capita from 1.21 million VND to 2.89 million VND over the same decade.
(Dữ liệu quan trọng trong báo cáo bao gồm mức tăng gấp ba lần thu nhập bình quân đầu người hàng tháng từ 1,387 triệu đồng năm 2010 lên 4,230 triệu đồng vào năm 2020, cũng như mức tăng đáng chú ý về chi tiêu bình quân đầu người hàng tháng từ 1,21 triệu đồng lên 2,89 triệu đồng trong năm 2010 cùng một thập kỷ.)
Thông tin: In 2010, the average monthly per capital income was 1.387 million VND, but this rose sharply to 4.230 million VND after ten years. Similarly, the second graph shows a steady increase in average monthly expenditure per capital per person.
(Năm 2010, thu nhập bình quân đầu người hàng tháng là 1,387 triệu đồng, nhưng con số này đã tăng mạnh lên 4,230 triệu đồng sau 10 năm. Tương tự, biểu đồ thứ hai cho thấy mức tăng đều đặn trong chi tiêu bình quân hàng tháng trên đầu người trên mỗi người. )
Bài 3
3 Read the Writing box. Then complete the sentences with the correct form of the phrases in brackets.
(Đọc phần Viết. Sau đó hoàn thành câu với dạng đúng của cụm từ trong ngoặc.)
Phương pháp giải:
Writing
(Viết)
Changes are often described using phrases that contain an adjective + noun or a verb + adverb
(Những thay đổi thường được mô tả bằng các cụm từ có chứa tính từ + danh từ hoặc động từ + trạng từ)
|
adjective + noun (tính từ + danh từ) |
verb + adverb (động từ + trạng từ) |
|
steady increase / decrease (tăng/giảm ổn định) |
increase / decrease (tăng/giảm đều đặn) |
|
consistent rise / fall (tăng/giảm nhất quán) |
rise / fall consistently (tăng/giảm liên tục) |
|
dramatic jump (cú nhảy vọt) |
jump / fall dramatically (tăng/giảm đột ngột) |
Comparative and superlative phrases
(Cụm từ so sánh và so sánh nhất)
largest / greatest jump
(bước nhảy lớn nhất)
smaller increase
(tăng ít hơn)
most consistent rise
(mức tăng ổn định nhất)
1 The percentage of poorer households since 2005. (slow growth)
2 Home prices have over the past 2 years. (steady increase)
3 There is a in the number of college and university graduates. (decline gradually)
4 We have seen a in wages since 2000. (increase significantly)
5 There has been a in the number of rural households using hygienic latrines over the past 10 years. (surge suddenly)
Lời giải chi tiết:
1 The percentage of poorer households has experienced slow growth since 2005.
(Tỷ lệ hộ nghèo tăng chậm kể từ năm 2005.)
2 Home prices have experienced a steady increase over the past 2 years.
(Giá nhà đã tăng đều đặn trong 2 năm qua.)
3 There is a gradual decline in the number of college and university graduates.
(Số lượng sinh viên tốt nghiệp đại học và cao đẳng ngày càng giảm.)
4 We have seen a significant increase in wages since 2000.
(Chúng ta đã chứng kiến sự gia tăng đáng kể về tiền lương kể từ năm 2000.)
5 There has been a sudden surge in the number of rural households using hygienic latrines over the past 10 years.
(Số hộ gia đình nông thôn sử dụng nhà tiêu hợp vệ sinh tăng đột biến trong 10 năm qua)
Bài 4
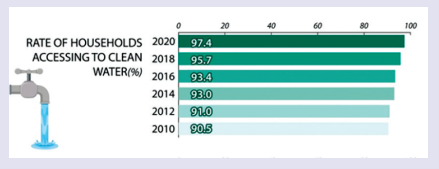
4 Write a paragraph (100-120 words) to describe changes in the following chart.
(Viết một đoạn văn (100-120 từ) mô tả những thay đổi trong biểu đồ sau.)
Lời giải chi tiết:
The chart depicts the percentage of households using clean water from 2010 to 2020. In 2020, 90.5 percent of households used clean water. This number has increased steadily to its peak in 2018 and reached 95.7%. And the number of households using water has jumped by 97.4% in 2020.
(Biểu đồ mô tả tỷ lệ hộ gia đình được sử dụng nước sạch từ năm 2010 đến năm 2020. Năm 2020, có 90,5 phần trăm hộ gia đình sử dụng nước sạch. Con số này đã đạt mức tăng ổn định đến đỉnh cao năm 2018 và đạt 95,7 %. Và quy chế gia đình sử dụng nước sách đã có cú nhảy vọt khi tăng đến 97,4% vào năm 2020.)
 Bình luận

- Tiếng Anh 9 Unit 3 Vocabulary in action
- Tiếng Anh 9 Unit 3 Revision
- Tiếng Anh 9 Unit 3 3.6 Speaking
- Tiếng Anh 9 Unit 3 3.5 Listening and Vocabulary
- Tiếng Anh 9 Unit 3 3.4 Grammar
>> Xem thêm
Tham Gia Group Dành Cho Học Sinh Lớp 9 - Ôn Thi Vào Lớp 10


Danh sách bình luận