Tiếng Anh 12 Bright Unit 3 3e. Writing
1. a) Look at the pie chart. What information does it contain? b) Read the report and fill in the gaps (1-5) with the information from the pie chart. 2. Which paragraph in the report in Exercise 1 ...
Bài 1 a
1. a) Look at the pie chart. What information does it contain?
(Nhìn vào biểu đồ tròn. Nó chứa thông tin gì?)
Phương pháp giải:
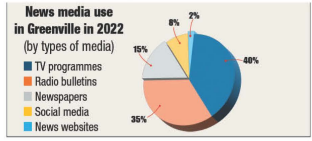
News media use in Greenville in 2022 (by types of media)
(Việc sử dụng phương tiện truyền thông tin tức ở Greenville vào năm 2022 (theo loại phương tiện truyền thông))
TV programmes: 40% (Chương trình truyền hình: 40%)
Radio bulletins: 35% (Bản tin phát thanh: 35%)
Newspapers: 15% (Báo chí: 15%)
Social media :8% (Mạng xã hội :8%)
News websites: 2% (Trang web tin tức: 2%)
Lời giải chi tiết:
The pie chart contains information about the percentage of news media use in Greenville in 2022 by types of media.
(Biểu đồ tròn chứa thông tin về phần trăm sử dụng phương tiện truyền thông tin tức ở Greenville vào năm 2022 ở các loại phương tiện truyền thông khác nhau.)
Bài 1 b
b) Read the report and fill in the gaps (1-5) with the information from the pie chart.
(Đọc báo cáo và điền vào các chỗ trống (1-5) với thông tin từ biểu đồ tròn.)
A. This pie chart illustrates the results of a survey on 1) _____. The survey was conducted in Greenville in 2022 and categorised news media use by media types. Overall, the chart indicates a visible trend in Greenville that people were most likely to use broadcast media as their primary news source.
B. Regarding the most significant portion of the graph, television programmes accounted for 2) _____ of all news media use among the residents of Greenville. Next to that, with a lower portion of the total, are 3) _____ which made up 35%. By contrast, only 4) _____ of people in Greenville used news websites to get their news. Furthermore, 5) _____ and social media accounted for only 15% and 8%, respectively.
C. Overall, it is dear from the survey data that most Greenville residents preferred to use broadcast media to get their news, whereas print and digital media added up to just over a quarter of the total use in the area.
Lời giải chi tiết:

A. This pie chart illustrates the results of a survey on news media use. The survey was conducted in Greenville in 2022 and categorised news media use by media types. Overall, the chart indicates a visible trend in Greenville that people were most likely to use broadcast media as their primary news source.
B. Regarding the most significant portion of the graph, television programmes accounted for 40% of all news media use among the residents of Greenville. Next to that, with a lower portion of the total, are radio bulletins which made up 35%. By contrast, only 2% of people in Greenville used news websites to get their news. Furthermore, newspapers and social media accounted for only 15% and 8%, respectively.
C. Overall, it is dear from the survey data that most Greenville residents preferred to use broadcast media to get their news, whereas print and digital media added up to just over a quarter of the total use in the area.
(A. Biểu đồ tròn này thể hiện kết quả của một cuộc khảo sát về việc sử dụng phương tiện truyền thông tin tức. Cuộc khảo sát được thực hiện tại Greenville vào năm 2022 và phân loại việc sử dụng phương tiện truyền thông tin tức theo loại phương tiện truyền thông. Nhìn chung, biểu đồ cho thấy xu hướng rõ ràng ở Greenville là mọi người có nhiều khả năng sử dụng phương tiện truyền thông phát sóng làm nguồn tin tức chính của họ nhất.
B. Với tỷ lệ lớn nhất trong biểu đồ, các chương trình truyền hình chiếm 40% tổng lượng sử dụng phương tiện truyền thông tin tức của cư dân Greenville. Bên cạnh đó, chiếm tỷ lệ thấp hơn trong tổng số, là các bản tin radio chiếm 35%. Ngược lại, chỉ có 2% người dân ở Greenville sử dụng các trang web tin tức để lấy tin tức. Hơn nữa, báo chí và mạng xã hội chỉ chiếm lần lượt 15% và 8%.
C. Nhìn chung, dữ liệu khảo sát cho thấy hầu hết người dân Greenville thích sử dụng các phương tiện truyền thông phát sóng để nhận tin tức của họ, trong khi các phương tiện truyền thông in ấn và kỹ thuật số chỉ chiếm hơn một phần tư tổng lượng sử dụng trong khu vực.)
Bài 2
2. Which paragraph in the report in Exercise 1 ...
(Đoạn văn nào trong báo cáo của bài 1…)
1. summarises and explains what the results indicate?
(tổng kết và giải thích những thứ kế quả chỉ ra?)
2. expresses the purpose of the chart and the general trend?
(thể hiện mục tiêu của biểu đồ và xu thế chung?)
3. describes and compares the chart sections?
(mô tả và so sánh các phần?)
Lời giải chi tiết:
|
1. C |
2. A |
3. B |
Bài 3
3. Read the report again. Underline the words/phrases whose meanings are similar to those in the Useful Language box.
(Đọc lại bài báo cáo lần nữa. Gạch chân dưới các từ/cụm từ có nghĩa giống với nghĩa của những từ/cụm từ trong Hộp Ngôn ngữ Thông dụng.)
|
Useful Language Box (Hộp Ngôn ngữ Thông dụng.) |
|
• represents (miêu tả, trình bày) • demonstrates (biểu diễn) • shows (thể hiện) • segment (đoạn, khúc) • part (phần) • share (phần (đóng góp...)) • comprised (bao gồm) • constituted (được tạo thành) • made up (cấu thành) • Besides (Bên cạnh đó) • In addition (Thêm vào đó) • Moreover (Hơn nữa) • While (Trong khi) • On the other hand (Mặt khác) • However (Tuy nhiên) • Whereas (Trong khi) • In general (Nhìn chung) • All in all (Nói tóm lại) • In conclusion (Kết luận) |
Lời giải chi tiết:
This pie chart illustrates the results of a survey on news media use. The survey was conducted in Greenville in 2022 and categorised news media use by media types. Overall, the chart indicates a visible trend in Greenville that people were most likely to use broadcast media as their primary news source.
Regarding the most significant portion of the graph, television programmes accounted for 40% of all news media use among the residents of Greenville. Next to that, with a lower portion of the total, are radio bulletins which made up 35%. By contrast, only 2% of people in Greenville used news websites to get their news. Furthermore, newspapers and social media accounted for only 15% and 8%, respectively.
Overall, it is dear from the survey data that most Greenville residents preferred to use broadcast media to get their news, whereas print and digital media added up to just over a quarter of the total use in the area.
Bài 4
4. Read the pie chart about social media use of teenagers in Greenville. Answer the questions.
(Đọc biểu đồ tròn về việc sử dụng mạng xã hội của các thanh thiếu niên ở Greenville. Trả lời các câu hỏi sau.)
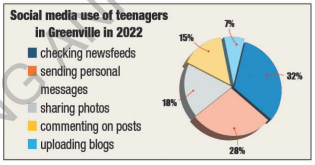 |
Social media use of teenagers in Greenville in 2022 (Việc sử dụng mạng xã hội của thanh thiếu niên Greenvill năm 2022) checking newsfeeds: 32% (xem bảng tin) sending personal messages: 28% (gửi tin nhắn cá nhân) sharing photos: 18% (chia sẻ hình ảnh) commenting on posts: 15% (bình luận trên các bài viết) uploading blogs: 7% (đăng tải các bài blog: 7%) |
1. What are you going to write?
(Bạn dự định sẽ viết gì?)
2. What key features does the pie chart indicate?
(Những ý chính nào mà biểu đồ tròn chỉ ra?)
3. What other information does the pie chart show?
(Những thông tin khác mà biểu đồ tròn thể hiện là gì?)
4. What conclusions can you make from the pie chart?
(Có thể đưa ra kết luận gì từ biểu đồ này.)
Lời giải chi tiết:
1. I’m going to write about the use of social media of teenagers in Greenville in 2022
(Tôi sẽ viết về việc sử dụng mạng xã hội của thanh thiếu niên Greenvill năm 2022.)
2. The key features would be the percentages of teenagers engaged in various activities: checking newsfeeds (32%), sending personal messages (28%), sharing photos (18%), commenting on posts (15%), and uploading blogs (7%).
(Những ý chính sẽ là phần trăm số thanh niên tham gia vào các hoạt động: xem bảng tin (32%), gửi tin nhắn cá nhân (28%), chia sẻ hình ảnh (18%), bình luận trên các bài viết (15%), and đăng tải các bài blog (7%).)
3. Checking newsfeeds and sending personal messages are the most common activities, while uploading blogs is the least common.
(Xem bảng tin và gửi tin nhắn cá nhân là các hoạt động phổ biến nhất trong khi, đăng blog là hoạt động kém phổ biến nhất.)
4. From the pie chart, we can conclude that teenagers in Greenville use social media primarily for checking newsfeeds and sending personal messages. Sharing photos and commenting on posts are also fairly common activities, while uploading blogs is less popular.
(Từ biểu đồ tròn, chúng ta có thể kết luận rằng thanh thiếu niên ở Greenville sử dụng mạng xã hội chủ yếu để xem bảng tin và gửi tin nhắn cá nhân. Chia sẻ ảnh và bình luận bài viết cũng là hoạt động khá phổ biến, trong khi việc đăng tải blog lại ít phổ biến hơn.)
Bài 5
5. Write a report using the information from the pie chart in Exercise 4 (about 180-200 words).
(Viết một bài báo cáo dùng các thông tin từ biểu đồ tròn ở bài tập 4. (khoảng 180 – 200 từ))
Paragraph 1: writing about the purpose of the chart, describing the general trend
(Đoạn 1: viết về mục đích của biểu đồ, mô tả xu hướng chung)
Paragraph 2: describing and comparing the sections of the chart in detail
(Đoạn 2: mô tả và so sánh chi tiết các phần của biểu đồ)
Paragraph 3: summarising the chart and explaining what the results indicate
(Đoạn 3: tóm tắt biểu đồ và giải thích những điều kết quả chỉ ra.)
Phương pháp giải:
When writing a pie chart report:
(Khi viết báo cáo về một biểu đồ tròn:)
• avoid using contractions (it's, can't, doesn't, etc.)
(tránh dùng các dạng viết tắt (it's, can't, doesn't, v.v.))
• avoid giving personal opinions (I think, In my view, etc.)
(tránh đưa ra quan điểm cá nhân (Tôi nghĩ, Theo góc nhìn của tôi, v.v)
• use objective language to describe and compare the data.
(sử dụng ngôn ngữ khách quan để miêu tả và so sánh dữ liệu)
By contrast, only 2% of the residents used news websites.
(Ngược lại, chỉ có 2% người dân sử dụng các trang web tin tức)
• use appropriate verb tenses (past, present or future)
(Sử dụng các thì phù hợp (quá khứ, hiện tại, hoàn thành)
In 2022, broadcast media accounted for 40% of all news media.
(Trong năm 2022, phương tiện truyền thông phát sóng chiếm 40% tổng số phương tiện truyền thông tin tức.)
By 2050, broadcast media are expected to account for up to 60% of all media use.
(Đến năm 2050, phương tiện truyền thông phát sóng dự kiến sẽ chiếm tới 60% tổng lượng sử dụng phương tiện truyền thông.)
Lời giải chi tiết:
This pie chart illustrate the result of a survey on social media use on teenagers. The survey was conducted in Greenville in 2022 and categorized social media use by type of activities. Overall, the chart indicates a visible trend in Greenville that teenager were most likely to use social media platform for checking newsfeed and sending personal messages.
Regarding the most significant portion of the graph, checking newsfeed accounted for 32% of all social media use among the teenagers of Greenville. Next to that, with a lower portion of the total, are sending personal message which made up 28%. By contrast, only 7% of teenagers in Greenville used social media to upload their blogs. Furthermore, sharing photos and comment on posts accounted for 18% and 15%, respectively.
Overall, it is clear from the pie chart that teenagers in Greenville use social media primarily for checking newsfeeds and sending personal messages, whereas commenting on posts and uploading blogs added up to just nearly a quarter of the total use in the area.
(Biểu đồ tròn này thể hiện kết quả của một cuộc khảo sát về việc sử dụng mạng xã hội của thanh thiếu niên. Cuộc khảo sát được thực hiện tại Greenville vào năm 2022 và phân loại việc sử dụng mạng xã hội theo các loại hoạt động. Nhìn chung, biểu đồ cho thấy xu hướng rõ ràng ở Greenville rằng các thiếu niên thường dùng mạng xã hội chủ yếu là để xem bảng tin và gửi những tin nhắn cá nhân.
Với tỷ lệ lớn nhất trong biểu đồ, việc xem bảng tin chiếm 32% tổng lượng sử dụng mạng xã hội của thanh thiếu niên ở Greenville. Bên cạnh đó, chiếm tỷ lệ thấp hơn trong tổng số, là gửi các tin nhắn cá nhân chiếm 28%. Ngược lại, chỉ có 7% số thanh thiếu niên ở Greenvile sử dụng mạng xã hội để đăng các bài blogs. Hơn nữa, việc chia sẻ hình ảnh và bình luận trên các bài đăng chỉ chiếm lần lượt 18% và 15%.
Nhìn chung, dữ liệu của biểu đồ tròn cho thấy hầu hết người dân Greenville sử dụng mạng xã hội chủ yếu là để xem bảng tin và gửi những tin nhắn cá nhân, trong khi việc bình luận trên các bài đăng và đăng tải các bài blog chỉ chiếm gần một nửa so với tổng lượng sử dụng trong khu vực)
Bài 6
6. Check your report for spelling/grammar mistakes. Then, in pairs, swap your reports and check each other's work.
(Kiểm tra lỗi chính tả và lỗi ngữ pháp. Sau đó, theo cặp, đổi bài cho nhau và chấm bài.)
 Bình luận